
How to Conduct an Analysis and Produce Results that Relate to Your Hypotheses
These are the answers that your research produced. This is not a presentation of raw data, but a presentation of the numbers or facts determined from the analysis. If you are using a hypothesis, this is where you state whether you accept or reject that hypothesis. Properly formatted tables and charts can make this a very short but very effective section. It is not always necessary to repeat in paragraphs what you show in a chart. Text should lead the reader to the chart or table, not repeat what can already be seen.
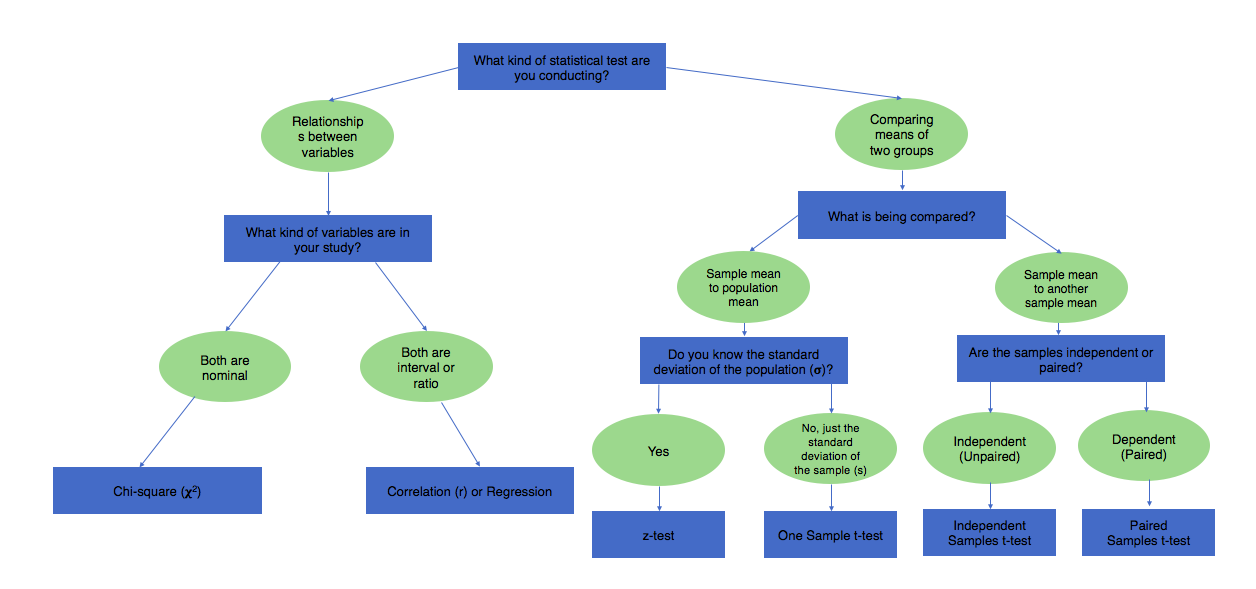
Before conducting your analysis, it is important to know which type of statistical test is more appropriate given your research design, the type of data that you have collected, and your research question. While there are many types of statistical tests available, some commonly used ones include those listed below.
Click on the test that you wish you use. You will be redirected to an online calculator where you can enter your data to get the resulting statistic. This will help you in writing your results.